Overview
You can check the signal strength and communication quality of your Z-Wave devices directly in Home Assistant or in Z-Wave JS UI.
Z-Wave is a mesh network. This means that devices can communicate directly with the controller or through other powered Z-Wave devices.
Because of this, signal quality is not checked only by distance. It is also checked by the route used by the device and the quality of communication on that route.
The most useful values to check are:
RSSI: signal strength
LWR: Last Working Route
Packet statistics: sent, received, and dropped packets
Node status: alive, asleep, or dead
Health Check result: route quality score, if available
Option 1: Check signal information in Home Assistant
If you use the standard Z-Wave JS integration in Home Assistant, you can check basic device diagnostics and communication statistics.
Steps
Open Home Assistant.
Go to Settings.
Open Devices & services.
Select the Z-Wave integration.
Open the Devices tab.
Select the Z-Wave device you want to check.
Open Configure.
Select Statistics.
In the statistics page, you can check the communication data for the selected device.
Example:
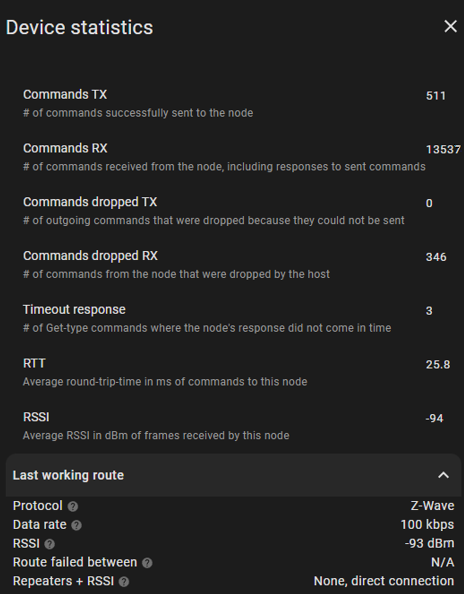
Useful values in Home Assistant
Depending on your setup and device type, you may see:
| Value | Meaning |
|---|---|
| Node status | Shows if the device is alive, asleep, or dead |
| Ping button | Sends a test command to check if the device responds |
| Statistics | Shows communication information and packet data |
| Failed commands | Shows if the device has communication problems |
| Last Working Route | Shows the last route used by the device |
Node status explanation
| Node status | Meaning |
|---|---|
| Alive | The device is reachable and responding |
| Asleep | Normal state for many battery-powered devices |
| Dead | The controller cannot communicate with the device |
If a mains-powered device is shown as Dead, check power supply, distance, routes, and possible interference.
If a battery-powered device is shown as Asleep, this is usually normal.
Option 2: Check signal strength in Z-Wave JS UI
Z-Wave JS UI gives more detailed Z-Wave information than the standard Home Assistant view.
It is recommended when you need to check signal quality, routes, and mesh health.
Method A: Use the Z-Wave JS UI Control Panel
Open Z-Wave JS UI.
Go to the Control Panel.
Find the device in the device list.
Check the statistics shown in the device row.
The statistics can include:
Sent packets
Received packets
Dropped packets
Timeout information
Communication quality data
A high number of dropped packets or failed commands can point to a weak or unstable connection.
Example: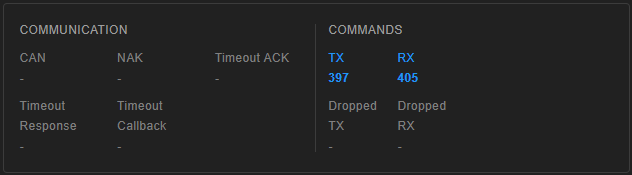
Method B: Use the Network Graph
The Network Graph is one of the easiest ways to check Z-Wave signal strength and routes.
Steps
Open Z-Wave JS UI.
Open Network Graph from the side menu.
Find the device in the graph.
Select the device.
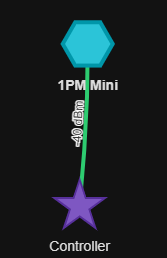
Check the line between the device and the controller, or between the device and another Z-Wave device.
The signal strength is shown on the line that represents the connection.
The line can show the communication path between:
The device and the controller
The device and another Z-Wave routing device
This is useful because the device may not communicate directly with the controller. It may use another mains-powered Z-Wave device as a repeater.
Example:
Method C: Run a node Health Check
Z-Wave JS UI can also run a built-in Health Check for a node.
This test actively checks the communication quality of the selected device.
Steps
Open Z-Wave JS UI.
Go to the Control Panel.
Click the device row to open the device details.
Open the Advanced tab or action menu.
Click Diagnose (Health Check).
Wait until the test finishes.
The Health Check may show:
Route quality score
RSSI margin
Number of failed pings
Route information
Communication delay
Example:
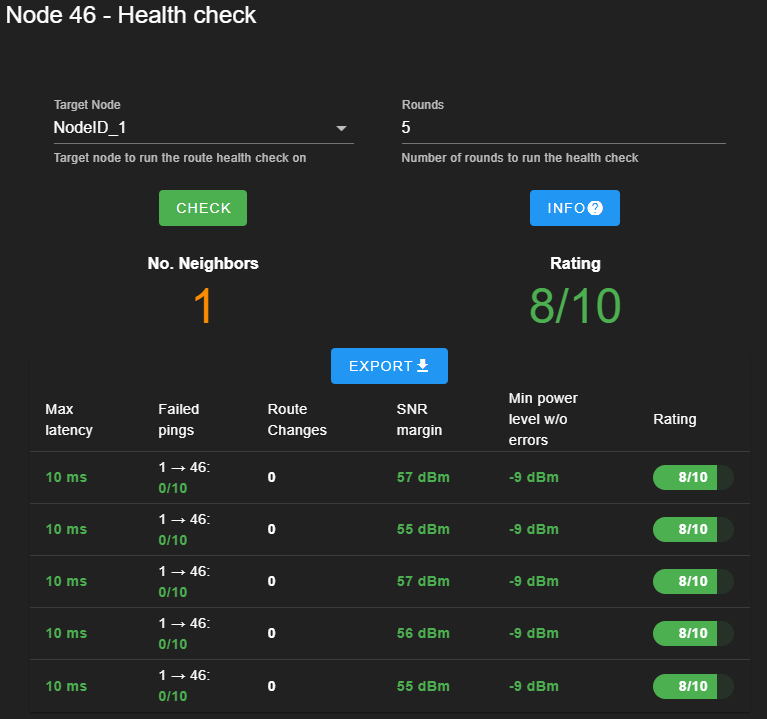
Health Check result
A higher route quality score means better communication.
| Score | Meaning |
|---|---|
| 8–10 | Good communication |
| 5–7 | Acceptable, but can be improved |
| 1–4 | Weak or unstable communication |
If the score is low, check device position, repeaters, routing, and interference.
Understanding RSSI values
RSSI means Received Signal Strength Indicator. It shows how strong the received radio signal is. RSSI is shown in dBm. The value is normally negative. A value closer to 0 dBm is stronger.
Node RSSI
Node RSSI shows the signal strength between Z-Wave nodes.
| Node RSSI value | Signal quality |
|---|---|
| -30 dBm to -70 dBm | Good signal |
| -70 dBm to -85 dBm | Medium signal |
| -90 dBm to -100 dBm | Weak signal |
Example:
-45 dBm is stronger than -85 dBm
-95 dBm is weak and may cause communication problems
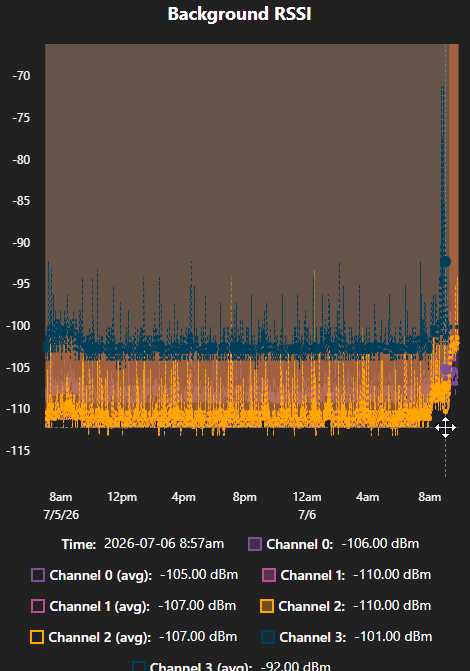
Understanding background RSSI
Background RSSI shows the radio noise around the Z-Wave controller. This is also called the noise floor.
For background RSSI, lower values are better.
| Background RSSI value | Meaning |
|---|---|
| -100 dBm to -110 dBm | Good, low noise |
| -80 dBm to -90 dBm | Acceptable noise |
| -30 dBm to -60 dBm | High noise, possible interference |
High background noise can reduce Z-Wave communication quality.
Possible causes include:
Other radio devices nearby
USB 3.0 interference near the Z-Wave USB controller
Poor USB extension cable quality
Controller placed too close to the computer or hub
Metal cabinet or electrical panel
Other devices using nearby frequencies
Example:
RSSI margin
The RSSI margin is the difference between the device signal and the background noise. For stable communication, the device signal must be clearly stronger than the noise floor.
As a general rule:
More than 20 dBm margin is good
15–20 dBm margin is acceptable
Less than 15 dBm margin can cause problems
If the node RSSI is too close to the background RSSI, the device may:
Respond slowly
Drop offline
Fail commands
Miss reports
Show as dead
Have unstable routing
What to check if the signal is weak
If the Z-Wave signal is weak or unstable, check the following:
Move the Z-Wave controller away from the computer or hub.
Use a short USB extension cable for the Z-Wave USB stick.
Avoid placing the controller inside a metal cabinet.
Add a mains-powered Z-Wave device between the controller and the weak device.
Run Rebuild Routes in Z-Wave JS UI.
Run a Health Check again after changes.
Check if the device has power.
Check if the device is too far from the mesh.
Check for high background RSSI noise.
Wait for the mesh to update after moving devices.
Battery-powered devices usually do not repeat Z-Wave traffic. For a stronger mesh, use mains-powered Z-Wave devices.
Good practice for Z-Wave mesh health
To keep the Z-Wave network stable:
Keep the controller in an open location.
Use a USB extension cable for USB Z-Wave sticks.
Add enough mains-powered Z-Wave devices to build a strong mesh.
Include devices close to the controller when possible.
After installation, allow the network time to update routes.
Use Rebuild Routes if a device was moved.
Check the Network Graph after adding or moving devices.
Avoid placing Z-Wave devices behind metal covers or inside metal boxes.
Summary
You can check Z-Wave signal strength in two main ways:
In Home Assistant through Settings > Devices & services > Z-Wave > Device > Configure > Statistics
In Z-Wave JS UI through the Control Panel, Network Graph, or Health Check
For the best overview, use Z-Wave JS UI Network Graph. The signal strength is shown on the line between the device and the controller or between the device and another Z-Wave routing device. Good Z-Wave communication depends on signal strength, low background noise, good routing, and a healthy mesh network.